01 / The question
California is often described as one of the world’s biggest economies. Is that true, and if every state were its own country, how far down the world’s list would the rest of the country reach?
02 / What I found
5th
California, at $4.30 trillion, would rank 5th among the world’s countries, between Japan ($4.44 trillion) and the United Kingdom ($4.00 trillion).
29
29 of the 50 states would rank among the world’s 50 largest economies, and 14 would make the top 25.
8th · 10th
Texas ($2.93 trillion) would rank 8th, just ahead of Russia. New York ($2.47 trillion) would rank 10th, ahead of Canada.
97th
Vermont, the smallest state economy at $49.7 billion, is about the size of Turkmenistan. It would still outrank 90 countries.
03 / Chart
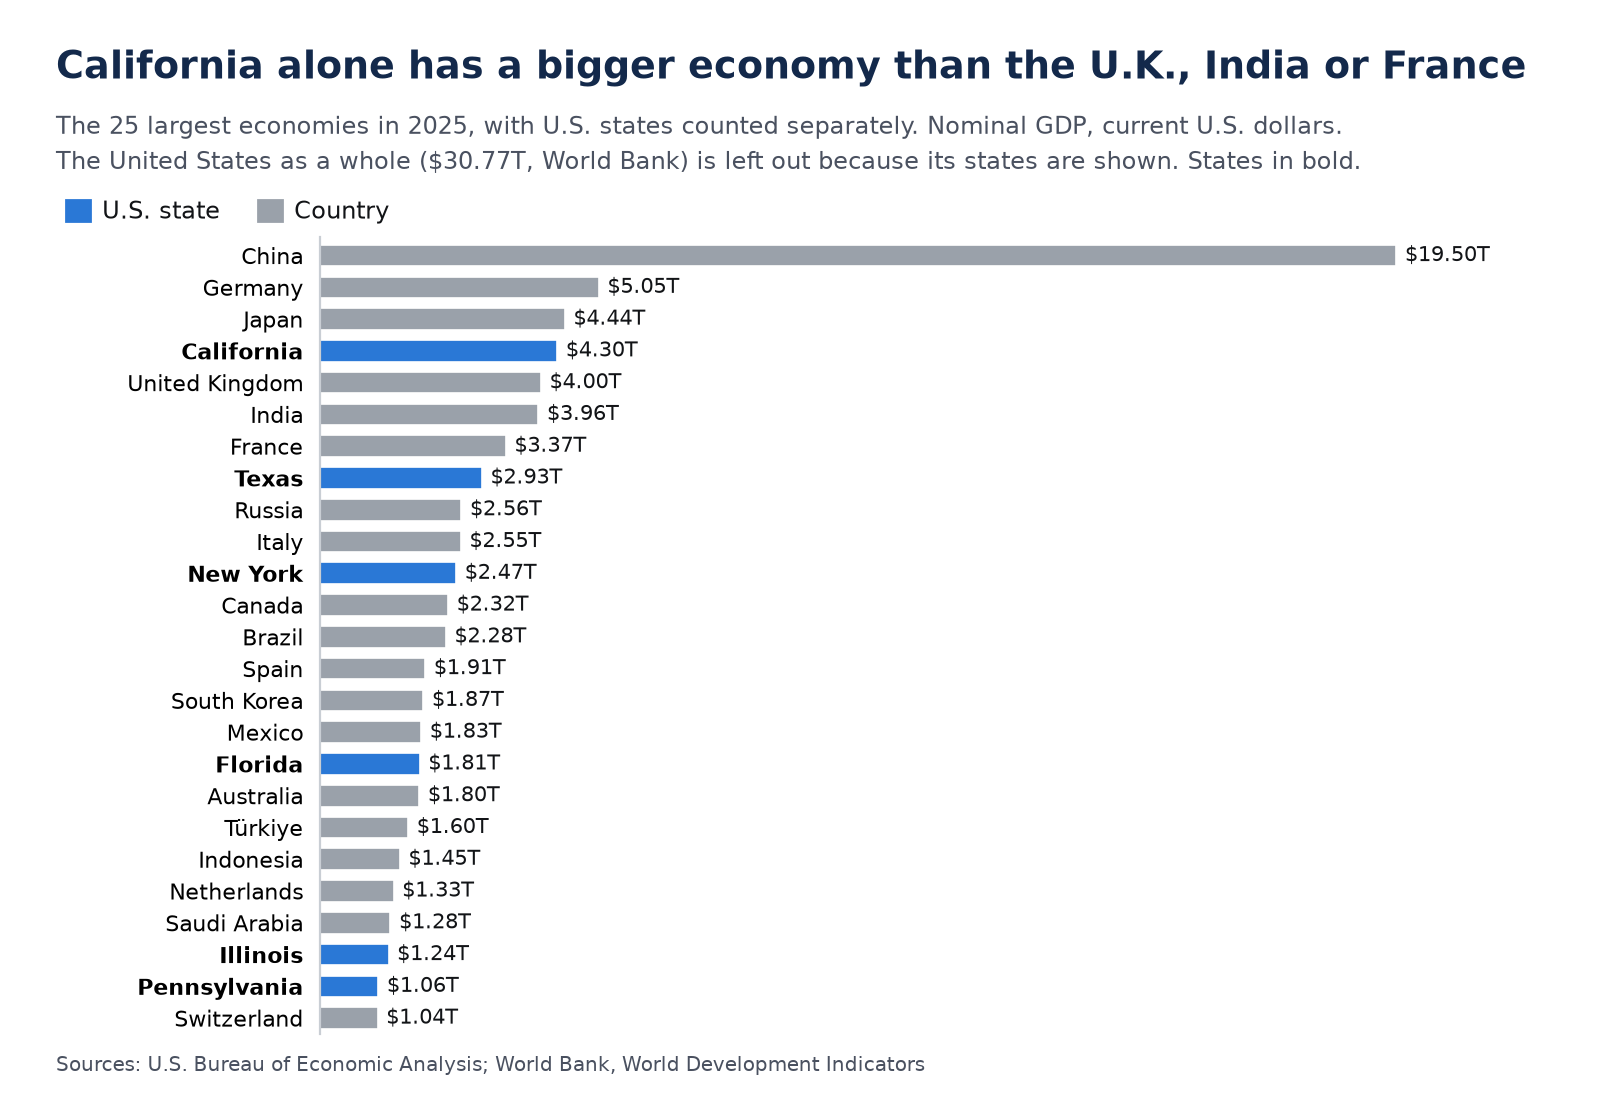
Sources: U.S. Bureau of Economic Analysis; World Bank, World Development Indicators (CC BY 4.0). Ranks count the United States itself as a country.
Show the numbers behind the chart
| Economy | Type | 2025 GDP |
|---|---|---|
| China | Country | $19.50T |
| Germany | Country | $5.05T |
| Japan | Country | $4.44T |
| California | State | $4.30T |
| United Kingdom | Country | $4.00T |
| India | Country | $3.96T |
| France | Country | $3.37T |
| Texas | State | $2.93T |
| Russia | Country | $2.56T |
| Italy | Country | $2.55T |
| New York | State | $2.47T |
| Canada | Country | $2.32T |
| Brazil | Country | $2.28T |
| Spain | Country | $1.91T |
| South Korea | Country | $1.87T |
| Mexico | Country | $1.83T |
| Florida | State | $1.81T |
| Australia | Country | $1.80T |
| Türkiye | Country | $1.60T |
| Indonesia | Country | $1.45T |
| Netherlands | Country | $1.33T |
| Saudi Arabia | Country | $1.28T |
| Illinois | State | $1.24T |
| Pennsylvania | State | $1.06T |
| Switzerland | Country | $1.04T |
04 / How the data came together
State GDP comes from the Bureau of Economic Analysis: table SAGDP2, GDP in current dollars, with 2025 estimates released September 30, 2026. Country GDP comes from the World Bank’s World Development Indicators, GDP in current U.S. dollars. I used 2025, the newest year both publish.
The World Bank lists 217 economies once its regional and income-group totals are removed; 186 have a 2025 value. Each state was slotted into that country list on its own, so states never push each other down the ranking.
SourcesBEA state GDP · World Bank country GDP
ScriptDownload, clean and rank, in Python
ChecksTotals, spot checks, missing data
OutputThis chart and table
05 / Checks
- PASSThe 50 states plus DC add up to BEA’s U.S. total, except $164.7 billion of federal military and civilian activity abroad, which BEA assigns to no state.
- PASSCalifornia’s $4,297,449.8 million matches BEA’s own California fact sheet exactly.
- PASSBEA’s U.S. total ($30.86 trillion) is within 0.3% of the World Bank’s ($30.77 trillion). The gap matches BEA’s September 2026 revision, which the World Bank figure predates.
- PASSLeaving out the 31 economies with no 2025 value doesn’t change the headline. The largest one missing, the United Arab Emirates ($552 billion in 2024), would move only the 33 smallest states down one place.
06 / Limits
- Exchange rates, not purchasing power. Countries are converted to dollars at market exchange rates, so a currency swing moves a country without any change in what it produces. Measured at purchasing power, many lower-income countries would look larger.
- Estimates get revised. Both publishers will revise their 2025 figures, and 31 economies have no 2025 value yet.
- States aren’t separate economies. They share one currency, one central bank and one federal budget. This compares size, not what a state could do on its own.
- “Countries” means the World Bank’s list of economies, which includes a few territories, such as Hong Kong and Puerto Rico.
07 / Code
The Python script downloads both publishers’ files, builds the ranking, runs every check above and draws the chart. It will be on GitHub with the rest of my code.
08 / Credits
U.S. Bureau of Economic Analysis, “SAGDP2 Gross Domestic Product (GDP) by state: All industry total, millions of current dollars,” 2025 estimates released September 30, 2026, https://apps.bea.gov/regional/zip/SAGDP.zip (accessed October 23, 2026).
The World Bank: World Development Indicators, GDP (current US$) (NY.GDP.MKTP.CD): Country official statistics, National Statistical Organizations and/or Central Banks; National Accounts data files, Organisation for Economic Co-operation and Development (OECD); Staff estimates, World Bank (WB). Accessed October 23, 2026. Licensed under CC BY 4.0. Changes: combined with BEA state estimates and re-ranked.
Analysis by Kurt Selden, with help from Claude Code. Every number was checked against the original publisher.